Faili:Standard deviation diagram.svg

Size of this PNG preview of this SVG file: piseli 400 × 200. Ukubwa zingine: piseli 320 × 160 | piseli 640 × 320 | piseli 1,024 × 512 | piseli 1,280 × 640 | piseli 2,560 × 1,280.
Faili halisi (faili la SVG, husemwa kuwa piseli 400 × 200, saizi ya faili: 17 KB)
| Faili hili linatoka Wikimedia Commons. Maelezo yapo kule kwenye ukurasa wake wa maelezo unaonekana hapo chini.
|
Muhtasari
| Maelezo |
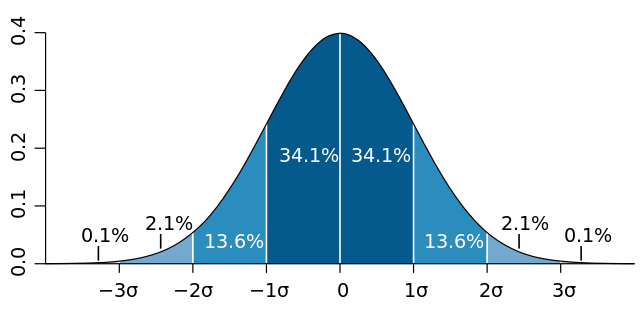
English: Normal distribution curve that illustrates standard deviations. Each band has 1 standard deviation, and the labels indicate the approximate proportion of area (note: these add up to 99.8%, and not 100% because of rounding for presentation.)
Français : Courbe de distribution normale montrant l'écart type. Chaque bande verticale a une largeur d'un écart type et les pourcentages indiquent leur valeur approximative rapportée à la population totale. Note : du fait des arrondis, le total est de 99,8 % au lieu de 100%. |
| Tarehe | |
| Chanzo | Kazi yangu, based (in concept) on figure by Jeremy Kemp, on 2005-02-09 |
| Mwandishi | M. W. Toews |
| Matoleo mengine |
|
.svg)
Hatimiliki
This file is licensed under the Creative Commons Attribution 2.5 Generic license.
- Uko huru:
- kushiriki – kunakili na kusambaza kazi hiyo
- kwa remix – kurekebisha kazi
- Chini ya masharti yafuatayo:
- sifa – Ni lazima utoe mkopo unaofaa, utoe kiungo cha leseni, na uonyeshe ikiwa mabadiliko yalifanywa. Unaweza kufanya hivyo kwa njia yoyote inayofaa, lakini si kwa njia yoyote inayopendekeza mtoa leseni akuidhinishe wewe au matumizi yako.
Historia ya faili
Bonyeza tarehe/saa kuona faili kama ilivyoonekana wakati huo.
| Tarehe/Saa | Picha ndogo | Vipimo | Mtumiaji | Maelezo | |
|---|---|---|---|---|---|
| sasa hivi | 02:06, 15 Januari 2015 | | 400 × 200 (17 KB) | GliderMaven | Average is now zero not mu |
| 11:08, 7 Aprili 2007 |  | 400 × 200 (14 KB) | Petter Strandmark | == Summary == Standard deviation diagram, based an original graph by Jeremy Kemp, in 2005-02-09 [http://pbeirne.com/Programming/gaussian.ps]. This figure was started in R using: <pre> x <- seq(-4,4,.1) plot(x,dnorm(x),type |
Matumizi ya faili
Ukurasa huu umeunganishwa na faili hili:
Matumizi ya faili ulimwenguni
Wiki nyingine hutumia faili hizi:
- Matumizi kwa af.wikipedia.org
- Matumizi kwa ar.wikipedia.org
- Matumizi kwa ast.wikipedia.org
- Matumizi kwa as.wikipedia.org
- Matumizi kwa ba.wikipedia.org
- Matumizi kwa be-tarask.wikipedia.org
- Matumizi kwa bg.wikipedia.org
- Matumizi kwa bn.wikipedia.org
- Matumizi kwa bs.wikipedia.org
- Matumizi kwa ca.wikipedia.org
- Matumizi kwa cbk-zam.wikipedia.org
- Matumizi kwa cs.wikipedia.org
- Matumizi kwa cv.wikipedia.org
- Matumizi kwa cy.wikipedia.org
- Matumizi kwa dag.wikipedia.org
- Matumizi kwa da.wikipedia.org
- Matumizi kwa de.wikipedia.org
- Matumizi kwa de.wikiversity.org
- Matumizi kwa el.wikipedia.org
- Matumizi kwa en.wikipedia.org
Tazama matumizi zaidi ya kimataifa ya faili hii.